IQVIA™, the company behind the Allergy Alert™ on Pollen.com, has spent over 25 years studying pollen counts and the methods for pollen sampling.
We know how important pollen information is to allergy and hay fever sufferers, and how easily the information can be misunderstood. This is why we have developed one reporting scale, easily understood by viewers.
Our pollen levels are on a scale of 12. Low is 0-2.4, Low-Medium is 2.5-4.8, Medium is 4.9-7.2, High-Medium is 7.3-9.6, and High is 9.7-12.0.
These levels take into account how much pollen the allergy sufferer is likely to be exposed to for that given period.
Pollen counting has been recognized as an important process since the turn of the 20th century. Not only have pollen counts advanced our knowledge of the
role plant pollen plays in causing allergy, they have become a powerful tool just like accurate weather forecasts in day-to-day, individual health problem solving.
Allergy Alert pollen forecasts are generated using a combination of environmental, seasonal, and meteorological factors,
including historical pollen trends and weather conditions. These forecasts predict the level of pollen exposure allergy sufferers
are likely to encounter for up to four days in advance. Weather patterns play a crucial role in shaping these predictions,
helping individuals prepare for potential symptoms.
IQVIA, the company behind Pollen.com and the Allergy Alert forecast, has built its expertise with decades of historical pollen data,
some dating back to the 1960s. Part of this process involves advanced tools such as the
Rotorod® Sampler, a trusted technology
for collecting accurate pollen data. This technology, along with IQVIA’s analysis of seasonal and weather trends, ensures reliable
forecasts that help allergy sufferers stay informed and proactive in managing their symptoms.
The pollen forecasts that are provided by Pollen.com are a daily outcome of the extensive research which
IQVIA has performed over the past 20 years and are the driving force behind our Allergy Alerts.
An extensive database of pollen activity is the starting point for IQVIA's computation of the detailed
and accurate forecast of pollen levels for the period of the next three days. This database provides us with the
knowledge of the seasonal timing of pollination of the all of the various allergy-causing plants found in each
geographical area of the country. Daily past pollen counts from our extensive network are accessed and compared with normal seasonal patterns.
The second major element resulting from IQVIA's extensive research is the study of how pollen levels vary
based on several predictable factors. Powerful models have been developed or improved upon by our researcher staff in order to apply each of these many external variables against each pollen type.
The amount of each type of pollen being carried by air in your area does in fact vary, often dramatically both
daily and relative to other cities. The pollen level for each of the pollen types varies from one season to the next as well.
Much of this variation is caused by changing weather conditions which occur both ahead of the season and on a day-to-day basis throughout the pollination period.
The level of pollen from each currently pollinating allergenic plant type is then combined into a single
forecast value in much the same way as your local meteorologist creates the weather forecast.
If all of this sounds complicated, it is, and that's why we convert the complicated pollen levels of all
plant types in a single easy to understand pollen level. This level can then be interpreted by the hay fever
sufferer and Pollen.com viewer into the ranges of low, medium or high for each of the next three days.
There is no easy answer regarding where a person should live to avoid allergies. Unfortunately, due to the high level of transportability
of pollen grains over long distances, pollen cannot be avoided altogether, nor can other allergens such as molds, dust mites, and pet dander be avoided.
Until recent years, desert climates, such as parts of Arizona and Nevada, were relatively safe havens to avoid airborne pollen,
since native plants in these areas tended to be sparse, and consist mostly of ornamentals which were not wind-pollinated.
Insects would take care of transferring the heavy, sticky pollen from one plant to another, keeping the air relatively free of pollen.
However, with residential communities popping up throughout these areas, the situation has changed. The people moving from other parts of the country
would bring along their favorite trees, shrubs, and grasses to make the desert more "like home." With those plants came the airborne pollen,
and changed the content of the air during allergy seasons.
Many people relocate to avoid one particular allergen, and end up developing sensitivity to another type within the same family of allergens instead.
It is the protein in pollen that causes allergies. Proteins within a plant family are very similar and often highly cross-reactive.
It is extremely difficult to completely avoid an entire plant family when moving from one part of the country to another.
An individual may move from a location with a dense amount of the box elder (Acer negundo) tree, a member of the Maple Family,
only to find that their new location has plenty of other types of maple. After a few months or years, the individual may become sensitized (allergic) to the other types as well.
There really is no permanent, easy escape. General rules of thumb are:
mountainous areas tend to have very little weed pollen (but they do have considerable tree pollen)
forests tend to have little weed pollen, but obviously have enormous amounts of tree pollen.
areas populated by humans tend to have grass pollen, as do agricultural areas
the Pacific Northwest has a smaller amount of ragweed pollen than most other areas of the country
(but does have standard amounts of trees, grasses, and other weeds besides ragweed)
* Remember that these are generalizations only. Further research into any specific location should be performed to either disprove or affirm these generalizations before assuming they apply.
One may wish to vacation during the notoriously high pollen season of a particular plant, but this may not be practical.
Monitoring levels and counts of the particular pollen types that affect you, and reacting accordingly by
avoiding exposure as much as possible is about the only thing that can be done. Staying indoors during peak times,
and medicating properly may be ways to combat the problem. Working with your doctor, you can develop a plan of defense that may help you.
Actual pollen counts and our resulting forecasts can be used to represent wide geographic expanses, sometimes up to many miles. It is extremely rare to find multiple pollen counting stations throughout an entire metro area. Pollen counting is a time-consuming and costly commitment. Typically, if there is a pollen counting station in a city, it is used to represent the entire metro area. We make sure that we have adequate, reasonable, coverage of the metro areas throughout the United States for our pollen and weather sources.
There could be many reasons why our forecast ends up different than a pollen count reported for the same period.
Let's take an example that today's pollen count reported on a local radio station as high, is different than Allergy Alert's forecast of a 4.5 (bottom of the medium range). Here are just a few:
The pollen count reported on the radio as today's count is actually the 24 hours previous
to some hour today, at best. Remember that pollen counts represent pollen concentrations in the air in the very recent past.
To magnify the difference, many times pollen counts are reported late, or treated as current when they were actually taken a few days ago.
Occasionally you may have noticed a pollen count staying exactly the same a few days in a row. It is highly unlikely that the pollen concentration
was this constant; it is more likely that the report was repeated due to lack of new information from that pollen counting station.
The pollen count reported on the radio as today's count is actually covering numerous days in the recent past.
For instance, on Mondays, many pollen counting stations report a count which covers the period of Friday through Monday,
since no personnel were at the office to take down a sample from their rooftop sampler over the weekend. This count represents more of an "average"
than any true daily pollen events, but is very likely reported as "Monday's count." These longer sampling periods can be found throughout
any part of the week, too, due to lack of availability of the personnel needed to retrieve and analyze the samples.
The pollen count reported on the radio is using a non-uniform scale. Some pollen counting stations determine their own
low, medium, and high levels, meaning that a count we would consider in the medium range may be listed as in the high range by that particular station. Unfortunately, there aren't any guaranteed reporting standards that a pollen counting station must follow. The American Academy of Allergy, Asthma & Immunology (AAAAI) has a set standard, but not all stations follow it.
The pollen forecast takes into account forecasted weather. As we all know when our carefully planned picnics get rained out,
that weather forecasts are not perfect. If the actual weather does not come out as forecasted, it is very likely that our pollen forecasts will not match an actual pollen count taken in that area for the same time period.
This could be for any number of reasons. Here are a few:
There could be an error in the report of the pollen count. There are many factors going into a truly volumetric pollen count, meaning that it represents the number of pollen grains per cubic meter of air. The pollen analyst must go through a series of calculations to figure out how what they see in the microscope corresponds to an estimate of pollen concentration in the atmosphere. Human error with this calculation can easily skew the pollen count.
There are times when certain trees pollinate in unexpected "booms", sending pollen counts sky high for a day or two. There is no way that a forecasting model can take this into account. IQVIA knows when most of the trees, grasses, and weeds that affect allergy sufferers tend to pollinate in each area of the country. The existence and duration of such unique and short-lived phenomena as in this example are impossible to predict.
The location of the actual sampling device used to establish the pollen count may distort the pollen count. For instance, if a sampler is placed on the second story of a building, right next to an elm tree, when that particular tree starts to pollinate, that sampler will indicate huge numbers for elm pollen. Does that represent what that community is experiencing? Probably not, at least to that outrageous degree. Remember, one sampler is typically used to represent the pollen count for an entire community. If it is placed in such a way where very local vegetation (i.e. immediately surrounding the sampler) has an "unfair advantage" of being represented within a sample, it is not a very effective count during the time when that vegetation is most active.
To determine our forecasts, the Allergy Alert staff receives pollen counts from pollen counting stations across the country.
Many of our stations are allergy clinics or universities, whose primary interest is in pollen types that cause allergy symptoms.
These stations use a pollen sampler to obtain a sample of their environment. The stations then analyze the sample under a microscope
to determine the level and types of pollen in the air. We gather the counts from them and produce a forecast based on actual and historical
counts and current and forecasted weather conditions. Most pollen counting stations do not check for the level of particulates or pollution in the air.
Pollen is microscopic and typically unable to be seen with the naked eye when it is floating through the air. However, some seeds can be seen floating in the air. Cottonwood is a common example. However, by the time a cottonwood tree distributes it's "fluffy cotton" or seeds, it has actually wound down its actual pollination period. The cottonwood trees release the allergenic pollen before the seeds are produced and blown into the air.
On Pollen.com, we cannot list every species that is pollinating, only the leading three in terms of actual pollen counts and the allergenicity of the plant. Pine pollen typically does not cause allergies and is usually considered to be a nonallergenic plant. Pine trees do produce enormous amounts of pollen, covering surfaces with the yellow "dust", but generally does not cause allergic symptoms. Because of this, we typically don't list pine as a predominant pollen.
You can find photos and information on plants in our Pollen Research section. In the library, you can click on your state and it will bring up a list of all the allergenic plants in your area, with information on the plants and photos of both the plants and the pollen grains.
Trace amounts of pollen can be found in air samples in most locations, despite the likelihood that no allergenic plants are actually actively producing pollen locally. This typically occurs during the winter months, after the fall season has ended, and before the spring tree season has started. Pollen may be resuspended into the air from the ground, and other surfaces such as tree branches, blades of grass, buildings, or roadways. Contents of the mix of pollen can be any pollen type that was in the air in higher numbers in the season, pollen from previous years or even pollen which has been transported long distances through the upper atmosphere.
Your Allergy Alerts are only sent out when the pollen levels are above a trigger point, and in the "moderate" range, or a 4.0 on the Allergy Alert level scale.
This is GOOD news! The pollen level in your area has likely dropped. Check Pollen.com and you'll find the levels in your area are below 4 when you don't receive a report.
In order to receive the Allergy Alert forecast, the user must go to the Pollen.com website and sign up by clicking Sign up for Allergy Alert Emails. Then follow the directions listed. The process requires the user to enter customized information based on their own situation, and we cannot do it for them. This is a free service.
In order to change your email address or ZIP code for the receipt of our Allergy Alerts, please follow the instructions at the bottom of any Allergy Alert™ email. Go to the web address indicated, click on the submit button, and on the page containing your information, enter your new e-mail address or ZIP code, and select the update button. Your information is private - we cannot do it for you.
IQVIA, the company behind Pollen.com and Allergy Alert, helps to set the standards by which scientists and doctors operate their samplers, and by which they analyze their pollen samples to obtain accurate and consistent counts.
Publishing
IQVIA has published more than twenty peer-reviewed papers in allergy and palynology journals, comparing how pollen counts are reported, studying differences in how and where they are obtained, instructing readers how to correctly analyze their samples using mathematical formulas, seeking trends throughout the U.S. in data sets of ragweed pollination, and synthesizing broad collections of published material into tables and charts that make it easier to locate information on pollen reporting.
Manufacturing
IQVIA manufactures the Rotorod® Sampler, the most popular piece of equipment for obtaining pollen counts for decades. We instruct users how to properly obtain the best samples, and we provide customer service to hundreds of sampling locations.
Instructing
IQVIA also runs an aeroallergen identification course to instruct medical and environmental professionals on how to analyze pollen samples. This one- to two-day seminar stresses the importance of learning the anatomy of pollen grains and fungal spores in order to accomplish accurate identification in "pollen and spore counts," both indoors and outdoors. Instructors in the course include premiere experts in the fields of paleoecology and plant pathology.
What is a pollen count?
A pollen count is a measurement of how much pollen is in the air. This count represents the concentration of all the pollen (or of one particular type, like ragweed) in the air in a certain area at a specific time. It is expressed in grains of pollen per cubic meter over a 24 hour period.
How is pollen counting done?
A pollen sample is taken using an air-sampling device. These samplers collect particles from the air onto a transparent, sticky surface. The sample is then examined under a microscope, where the pollen grains are counted and identified. The result of this is the pollen count. Since pollen travels long distances through the air, this count is relevant to a large area, and a count from one sampling site is typically used as data for an entire city.
How long does it take to get a pollen sample?
It may sound easy, but pollen sampling can be time-consuming and expensive, sometimes requiring hours of work, and quite a bit of experience or training.
Where should the sampling devices be located?
The best location for a pollen sampler is on a rooftop, several stories from the ground. Rooftop placement provides an open space away from direct exposure to nearby vegetation, as well as protection from vandalism and theft. Elevation of the sampler allows it to collect pollen from a larger surrounding area. Poor placement of the sampler is near biases, contaminants, or obstructions. Locations near air ducts, under over-hanging tree branches, or next to a wall are also examples of poor sampler placement.
Who is responsible for the pollen counts?
Allergists, government agencies, educational institutions, private physicians, and commercial research companies.
What is the purpose of pollen counting?
Allergy sufferers may find it desirable to follow changes in the pollen counts. They will learn much more about which allergens are affecting them, and to what degree. Pharmaceutical companies need the information in their drug research. Allergy researchers need the information to find new trends between symptoms and allergy-inducing conditions. And, people that study plants also need the pollen data to learn more about growth stages and plant habitats throughout the Earth's history.
What is a pollen forecast?
A pollen forecast is a prediction of what the pollen levels will be in the future, like a weather forecast. Pollen forecasting often has greater value for allergy suffers than a pollen count, because they can use this information to plan their day, including whether or not to take medication. Typically, pollen counts show what was in the air several days earlier, not what's going to happen today or tomorrow. Pollen forecasting methods consider natural events, besides the recent pollen counts, that will affect future pollen levels. We consider historical pollen counts (which provide predominant pollen and seasonal trend information for a certain area) temperatures, precipitation, and weather forecasts. Pollen forecasts are geographically specific down to the city.
The company has published a series of articles and reports on allergy data and trends, including the Allergy Alert™ Forecast, for pharmaceutical and media industries. IQVIA also supplies equipment used for pollen and airborne particulate measurement, known as the Rotorod® Sampler. The Rotorod® Sampler is manufactured by IQVIA.
By clicking on a specific date, you have the ability to enter in how you feel and symptoms for that day.
Based on your information the date in the calendar will have a specific background color that correlates to how you felt that day.
Your information is automatically stored and the chart above will update. The diary chart will plot Pollen.com allergy index vs how you felt on that day.
You can also track current top allergens. For each day (for up to 90 days) your diary will display up to three predominant pollens that can be adjusted (if desired).
These are based on your current location set in your profile.
We also have notes area where you can store medications or any other relative information.
We try our best to get your current location to provide a seamless experience. We rely on a browser or your device to tell us your ZIP code. We also match the first searched city or ZIP with your profile to get your preferable location and remember it for next visit. Sometimes when it all fails we send you to the allergy capital #1 – Austin, Texas – the city where pollen levels are always on the rise.
You can always update your location by visiting this page.
If you like staying on top of latest allergy news and Pollen.com happenings you might want to try our site push notifications. But if you ever get tired of all the messages follow these easy steps on how to unsubscribe.
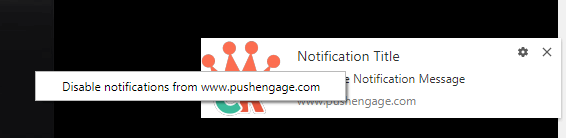
Method 1: Unsubscribe at the time you receive a notification from a website
Chrome offers a simple single click opt-out and if you right-click when you receive a browser push notification, it will show an option to disable notifications from that domain, as shown below.
Just click on that link to unsubscribe notifications in chrome. Here is an example.
Method 2: Unsubscribe from receiving a push notification from a website after clicking Allow.
Here are step by step instructions to unsubscribe from Chrome Push Notifications:
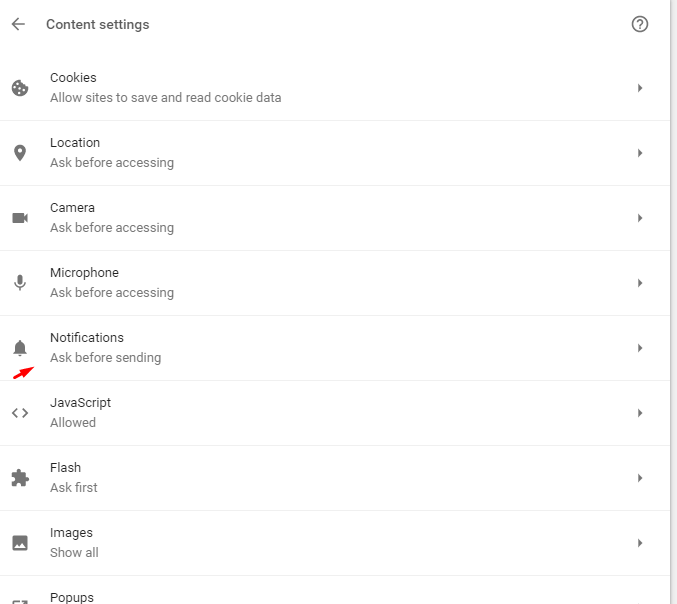
Open a new browser tab and type chrome://settings/content and you will see the below pop up
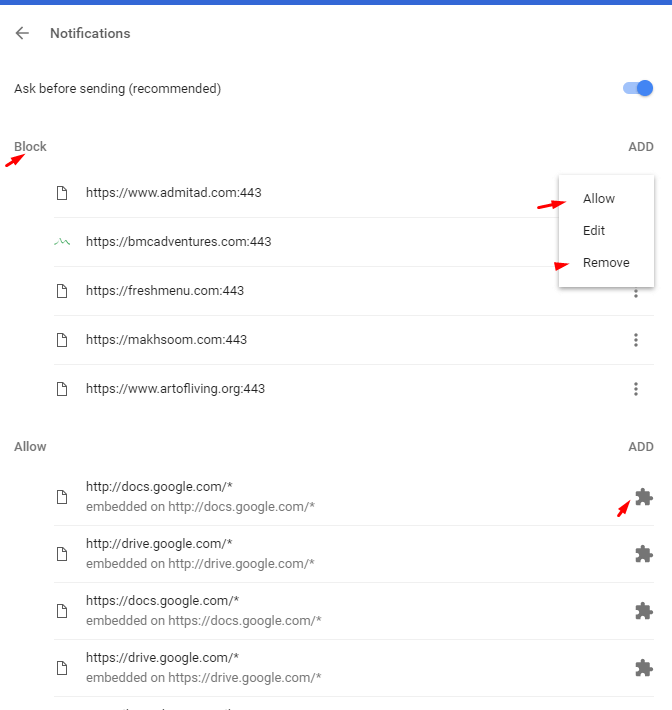
Go to the Notifications section and Click Manage Exceptions. This will list all the URLs from where you have subscribed to notifications. You can click on the URL of the site you want to unsubscribe. You can allow or deny or completely remove a website. To unsubscribe notifications from chrome, click on remove. You will be unsubscribed from chrome push notifications.
As you can see above, removing push notification in chrome is very simple.
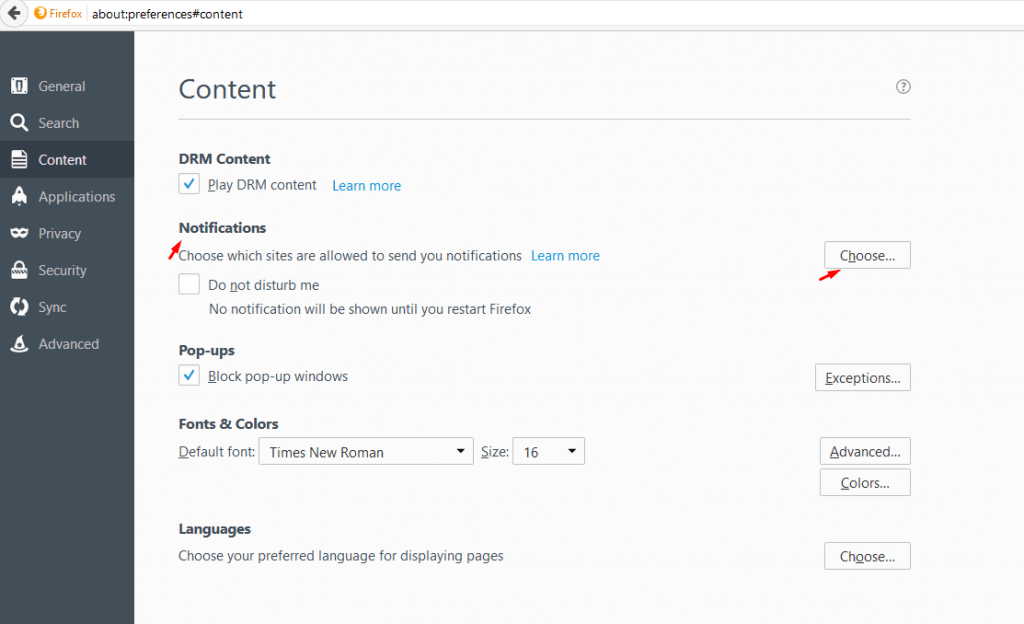
For Firefox Push Notifications, follow the steps outlined here (summarized Below):
Go to the Firefox menu and select Options.
Select the Content panel and click the Choose… button under Notifications.
Select the site.
Click Remove Site.
Once done, you are unsubscribed and won’t receive the Firefox push notification from that site.
Unsubscribe from Push Notifications In Mobile Browser
If you are trying to unsubscribe from the Chrome Mobile browser, follow the following steps.
Open the Chrome browser, then go to settings by clicking the menu on the top right.
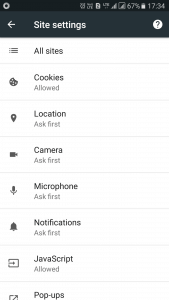
Go to Site Settings
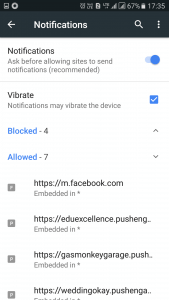
Next Click on Notifications.
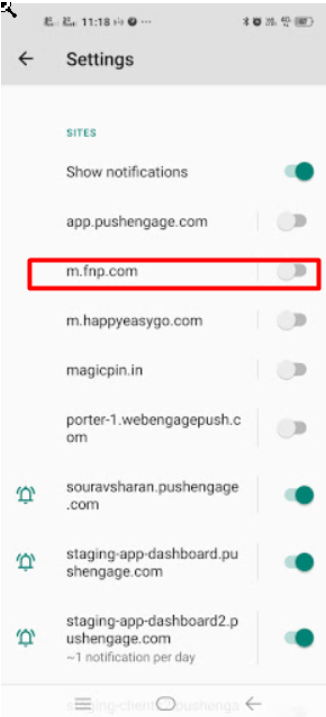
Here you will see a list of websites to whom you have granted permission to display notifications. Select the site you want to unsubscribe, and then click Clear and Reset.
Once done, you will be unsubscribed from the site and won’t receive any chrome push notification from them.
Web Push Notifications are there to keep users updated about important things. However, subscribers get overwhelmed with so many notifications that it starts to feel annoying and they want to disable chrome push notifications. To keep your customers happy, share this guide on your website so that they can stop chrome push notifications.
Using the push notification widget, you can always give customers another chance of subscribing to your push notifications.